Big data is a concept that is proving valuable to various industries, not least the automotive aftermarket. With this in mind, MAM Software showcases how it can use its platforms to provide an in-depth overview of the state of play of the aftermarket.
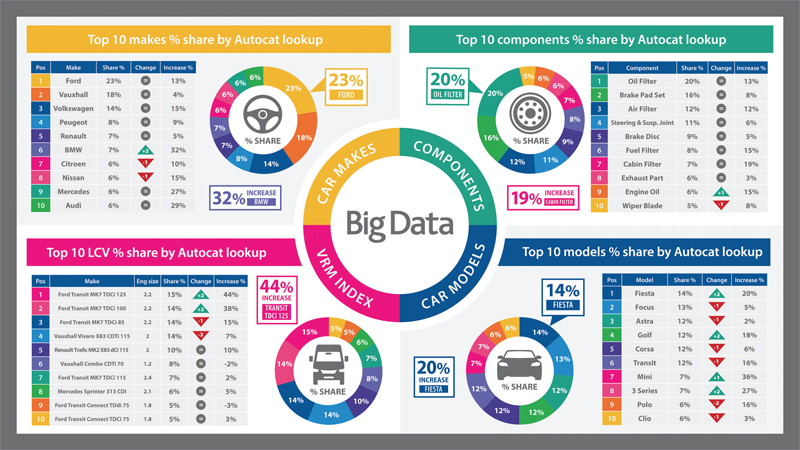
Last year, MAM Software announced that it would be offering big data services to its customers, enabling them to better understand market conditions and adjust their business accordingly. To illustrate the type of anonymised data available, MAM captured four different types of catalogue lookup being carried out across its entire user base; top ten car makes, top ten car models, top ten components and top ten light commercial vehicles.
The dataset used the total number of catalogue lookups posted to point of sale for a particular vehicle or component, and compared data within the period of April 2019 to January 2020. Points of note include:
- BMW, Mercedes and Audi all saw growth in lookups of close to 30%
- BMW jumped ahead of Citroen and Nissan in the ‘top makes’ table
- Oil filters, air filters and engine oil saw double-digit growth in lookups compared to April 2019
- The only change in the ‘top components’ saw engine oil and wiper blades trading places
- There were lots of changes in the ‘top models’ table, with the Ford Fiesta, VW Golf and BMW 3-Series making the biggest jumps
- The BMW Mini saw the biggest increase in lookups, growing by 36%
- The LCV market continued to be dominated by the Ford Transit MK7, with four variants appearing in the ‘top ten’
- The two most popular LCVs, Ford Transit 2.2s, saw the biggest increase in lookups – around 40%
By offering insight into parts lookup and fitment trends, motor factors can establish where product needs are changing, and recognise new business opportunities. The reliability of products is improving, so with this in mind, big data can help motor factors determine which parts they should be stocking, and which parts they may need to introduce to their current line-up.
Similarly, the data can help parts suppliers to understand where they have gaps in their ranges, particularly amongst the most popular vehicles.
Note: in terms of working days, April 2019 had 20 weekdays, eight weekend days and two bank holidays, compared to 22, eight and one, respectively, in January 2020. This will account for some of the increase in lookups that the company has recorded between the two periods.

The data within the above tables is as follows:
Pos – the current position of the vehicle or component based on lookups in January 2020.
Percentage share – the percentage share of lookups compared to the total lookups of the ‘top 10’ vehicles or components listed.
Change – the change in position in the table compared to April 2019.
Percentage increase – the percentage increase in lookups compared within the period of April 2019 to January 2020.


